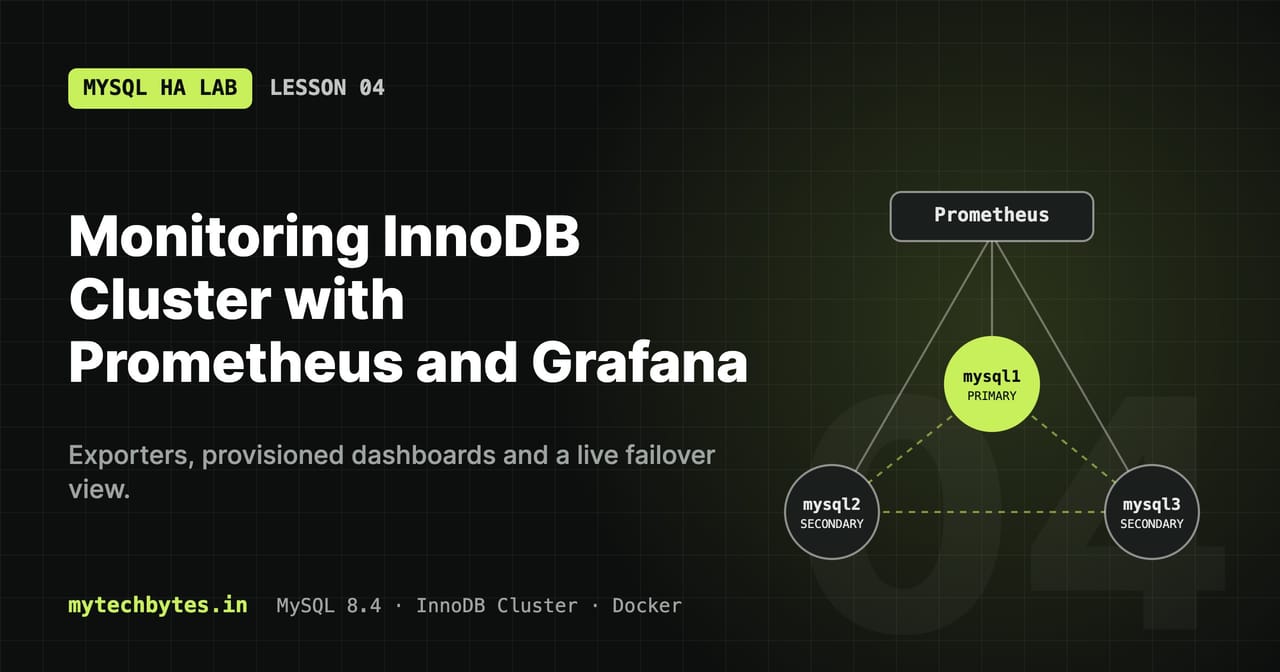
02-monitoring on GitHub. Previous: Lesson 3: Failover, quorum and recovery.Watch the cluster live: which node is primary, members leaving and returning, writes moving to a new primary, replication backlog, and (from Lesson 5) router health.
flowchart LR
    subgraph Cluster
        m1[("mysql1")]
        m2[("mysql2")]
        m3[("mysql3")]
    end
    e1["exporter-mysql1"] --> m1
    e2["exporter-mysql2"] --> m2
    e3["exporter-mysql3"] --> m3
    init["monitoring-init<br/>creates the exporter user"] -. "once, via router :6446" .-> Cluster
    prom["Prometheus :9090<br/>scrape every 5 s"] --> e1 & e2 & e3
    prom --> hap["HAProxy :8404/metrics"]
graf["Grafana :3000<br/>provisioned dashboards"] --> prom| Component | Role |
|---|---|
| monitoring-init | One-shot container that creates the read-only exporter user |
| mysqld-exporter ×3 | One per node. Reads that node's status and Group Replication tables and serves them as Prometheus metrics on port 9104. |
| Prometheus | Scrapes (pulls) all metrics every 5s and stores them as time series |
| Grafana | Dashboards on top of Prometheus |
Each exporter connects directly to its node, not through the router. Through the router you'd only ever see the primary.
Files in this lesson
docker-compose.yml                         # x-exporter, monitoring-init, exporters, prometheus, grafana
monitoring/init-exporter-user.sh           # creates the exporter user
monitoring/prometheus.yml                  # what Prometheus scrapes
monitoring/grafana/provisioning/
├── datasources/prometheus.yml             # Grafana → Prometheus connection
└── dashboards/dashboards.yml              # where Grafana loads dashboards from
monitoring/grafana/dashboards/
└── 1-overview.json … 6-connection-pools.json   # the dashboards (see "Dashboards" below)
Compose profile
All monitoring services have profiles: [monitoring]. They only start when the profile is enabled:
docker compose --profile monitoring up -d      # cluster + monitoring
docker compose up -d                           # cluster only
Commands without --profile monitoring ignore these services (e.g. docker compose down leaves them running). See Operations.
monitoring-init: the exporter user
  monitoring-init:
    image: mysql:8.4
    container_name: monitoring-init
    profiles: [monitoring]
    restart: on-failure
    depends_on: [router-lb]
    entrypoint: ['bash', '/monitoring/init-exporter-user.sh']
    environment:
      MYSQL_ROOT_PASSWORD: ${MYSQL_ROOT_PASSWORD}
      EXPORTER_USER: ${EXPORTER_USER}
      EXPORTER_PASSWORD: ${EXPORTER_PASSWORD}
    volumes:
      - ./monitoring:/monitoring:ro
    networks: [cluster]
| Key | Meaning |
|---|---|
restart: on-failure | If the script exits non-zero (e.g. an SQL error), Docker runs it again. A successful run stays exited. |
depends_on: [router-lb] | Starts after the load balancer container starts. Readiness is handled by the script's wait loop. (On branch 02-monitoring: [router].) |
entrypoint | Runs the script instead of a MySQL server |
environment | Root password to log in, exporter name and password to create |
monitoring/init-exporter-user.sh
until timeout 10 mysql --connect-timeout=5 -h mysql-router -P 6446 -uroot -p"$MYSQL_ROOT_PASSWORD" -e "SELECT 1" >/dev/null 2>&1; do
  echo "Waiting for router..."; sleep 3
done
mysql -h mysql-router -P 6446 -uroot -p"$MYSQL_ROOT_PASSWORD" <<SQL
CREATE USER IF NOT EXISTS '${EXPORTER_USER}'@'%'
  IDENTIFIED WITH caching_sha2_password BY '${EXPORTER_PASSWORD}'
  WITH MAX_USER_CONNECTIONS 5;
ALTER USER '${EXPORTER_USER}'@'%' IDENTIFIED WITH caching_sha2_password BY '${EXPORTER_PASSWORD}';
GRANT PROCESS, REPLICATION CLIENT, SELECT ON *.* TO '${EXPORTER_USER}'@'%';
SQL
| Part | Why |
|---|---|
timeout 10 ... --connect-timeout=5 | Each attempt ends after at most 10s. Without it, an attempt made while the cluster was still starting can hang forever on a dead connection: the loop never retries and the exporters never start, even after the cluster is healthy. |
Wait loop on mysql-router:6446 | Waits until there is a primary reachable through the router. Users must be created on the primary; Group Replication copies them to all nodes. The loop hides errors, see stuck on "Waiting for router...". |
CREATE USER IF NOT EXISTS | Safe to rerun |
caching_sha2_password | MySQL 8.4's default authentication plugin |
MAX_USER_CONNECTIONS 5 | Caps the exporter's connections. v0.20 opens up to 2 per scrape. |
ALTER USER | Resyncs the password if .env changed |
PROCESS | Read the process list and InnoDB status |
REPLICATION CLIENT | Read replication status |
SELECT ON *.* | Read performance_schema (Group Replication tables) and information_schema |
Exporters
x-exporter: &exporter
  image: prom/mysqld-exporter:v0.20.0
  profiles: [monitoring]
  restart: unless-stopped
  depends_on:
    monitoring-init:
      condition: service_completed_successfully
  environment:
    MYSQLD_EXPORTER_PASSWORD: ${EXPORTER_PASSWORD}
  networks: [cluster]

  exporter-mysql1:
    <<: *exporter
    container_name: exporter-mysql1
    command:
      - --mysqld.address=mysql1:3306
      - --mysqld.username=${EXPORTER_USER}
      - --collect.perf_schema.replication_group_members
      - --collect.perf_schema.replication_group_member_stats
| Key | Meaning |
|---|---|
condition: service_completed_successfully | Exporters start only after monitoring-init exited with code 0, i.e. the user exists |
MYSQLD_EXPORTER_PASSWORD | The exporter reads its password from this variable (note the D: MYSQLD_). A wrong name means no password, and mysql_up 0. |
command: as a YAML list | Each flag is a separate argument. The image runs the binary directly with no shell, so $VARIABLES inside the container are not expanded. ${EXPORTER_USER} works because Compose substitutes it before starting. |
--mysqld.address=mysqlN:3306 | The node this exporter watches. Each exporter must point at a different node. |
--mysqld.username | Login name; password comes from the variable above |
--collect.perf_schema.replication_group_members | Membership: host, role (PRIMARY/SECONDARY), state (ONLINE/RECOVERING/...) |
--collect.perf_schema.replication_group_member_stats | Queues, certified/applied transactions, conflicts, rollbacks |
Default collectors (global status, variables, InnoDB, ...) stay on. No ports are published; Prometheus reaches the exporters inside the Docker network on port 9104.
Prometheus
  prometheus:
    image: prom/prometheus:v3.13.4
    profiles: [monitoring]
    volumes:
      - ./monitoring/prometheus.yml:/etc/prometheus/prometheus.yml:ro
      - prometheus_data:/prometheus
    ports:
      - "9090:9090"
| Key | Meaning |
|---|---|
prometheus.yml mount | Scrape configuration |
prometheus_data:/prometheus | Time-series database on a named volume (default retention 15 days) |
9090:9090 | Web UI on http://localhost:9090 |
monitoring/prometheus.yml
global:
  scrape_interval: 5s
  evaluation_interval: 5s

scrape_configs:
  - job_name: mysql
    static_configs:
      - targets: ["exporter-mysql1:9104"]
        labels: { node: mysql1 }
      - targets: ["exporter-mysql2:9104"]
        labels: { node: mysql2 }
      - targets: ["exporter-mysql3:9104"]
        labels: { node: mysql3 }

  - job_name: prometheus
    static_configs:
      - targets: ["localhost:9090"]

  - job_name: haproxy
    static_configs:
      - targets: ["mysql-router:8404"]
| Setting | Meaning |
|---|---|
scrape_interval: 5s | How often every target is polled. Short, so a failover is visible within seconds (default is 1m). |
evaluation_interval: 5s | How often recording/alerting rules run (none defined yet) |
job_name | Added to every series as label job |
targets | host:port to scrape; path defaults to /metrics |
labels: { node: ... } | Extra label, so legends say mysql1 instead of exporter-mysql1:9104 |
job_name: haproxy | HAProxy's built-in exporter (Lesson 5) |
Grafana
  grafana:
    image: grafana/grafana-oss:13.0.2
    profiles: [monitoring]
    depends_on: [prometheus]
    environment:
      GF_SECURITY_ADMIN_USER: admin
      GF_SECURITY_ADMIN_PASSWORD: ${GRAFANA_ADMIN_PASSWORD:-admin}
      GF_DASHBOARDS_DEFAULT_HOME_DASHBOARD_PATH: /var/lib/grafana/dashboards/1-overview.json
    volumes:
      - ./monitoring/grafana/provisioning:/etc/grafana/provisioning:ro
      - ./monitoring/grafana/dashboards:/var/lib/grafana/dashboards:ro
      - grafana_data:/var/lib/grafana
    ports:
      - "3000:3000"
| Key | Meaning |
|---|---|
GF_* variables | Any Grafana setting can be set as GF_<SECTION>_<KEY> |
GF_SECURITY_ADMIN_PASSWORD | Admin password; :-admin is the fallback if .env doesn't set it |
GF_DASHBOARDS_DEFAULT_HOME_DASHBOARD_PATH | Opens this dashboard on the home page |
provisioning mount | Files Grafana reads at startup (datasource + dashboard provider) |
dashboards mount | The dashboard JSON files |
grafana_data | Grafana's own database (users, preferences) |
provisioning/datasources/prometheus.yml
apiVersion: 1
datasources:
  - name: Prometheus
    uid: prometheus
    type: prometheus
    access: proxy
    url: http://prometheus:9090
    isDefault: true
    jsonData:
      timeInterval: 5s
| Setting | Meaning |
|---|---|
uid: prometheus | Fixed ID; the dashboard JSON refers to the datasource by this uid |
access: proxy | Grafana's server queries Prometheus (inside the Docker network), not your browser |
url | Prometheus by its service name |
isDefault | Used by new panels and Explore |
timeInterval: 5s | Matches the scrape interval, so $__rate_interval picks sensible windows |
provisioning/dashboards/dashboards.yml
apiVersion: 1
providers:
  - name: mysql-ha
    folder: MySQL HA
    type: file
    allowUiUpdates: true
    options:
      path: /var/lib/grafana/dashboards
| Setting | Meaning |
|---|---|
type: file | Load dashboards from JSON files |
folder: MySQL HA | Grafana folder they appear in |
allowUiUpdates: true | You may edit in the UI; to keep changes, export the JSON back to the file |
options.path | Directory inside the container, the mounted monitoring/grafana/dashboards/ |
Don't confuse the two folders: provisioning/dashboards/ holds the provider config; dashboards/ holds the dashboard JSON. A JSON file in the provisioning folder results in an empty "MySQL HA" folder.
Start and verify
sequenceDiagram
    participant I as monitoring-init
    participant H as mysql-router:6446
    participant P as Primary
    participant E as Exporters
    participant Pr as Prometheus
    participant G as Grafana
    loop every 3 s, 10 s timeout per try
        I->>H: SELECT 1 as root
    end
    H->>P: route to the primary
    I->>P: CREATE / ALTER USER exporter, GRANT
    I-->>E: exit 0 (service_completed_successfully)
    E->>E: start, each connects directly to its node
    loop every 5 s
        Pr->>E: GET /metrics
        Pr->>H: GET :8404/metrics
    end
G->>Pr: PromQL queries for the dashboardschmod -R a+rX monitoring
docker compose --profile monitoring up -d
docker logs --tail 100 -f monitoring-init # expect: "Exporter user 'exporter' is ready"
| URL | What |
|---|---|
| http://localhost:3000 | Grafana → Dashboards → MySQL HA → 1 · Overview (login admin / GRAFANA_ADMIN_PASSWORD) |
| http://localhost:9090 | Prometheus → Status → Target health: 3 exporters, HAProxy, Prometheus, all UP |
# each exporter can log in (expect: mysql_up 1, three times)
for n in 1 2 3; do echo -n "exporter-mysql$n: "; docker exec exporter-mysql$n wget -qO- localhost:9104/metrics | grep '^mysql_up'; done

# each exporter watches the right node (expect server_id 1, 2, 3)
for n in 1 2 3; do docker exec exporter-mysql$n wget -qO- localhost:9104/metrics | grep '^mysql_global_variables_server_id'; done

# Group Replication metrics are available
docker exec exporter-mysql1 wget -qO- localhost:9104/metrics | grep -o '^mysql_perf_schema_[a-z_]*' | sort -u
If monitoring-init is stuck on "Waiting for router..."
monitoring-init retries every 3 seconds until it can log in as root through mysql-router:6446, and the exporters wait for it. The loop hides the real error, so it can wait forever without saying why. Most common after Docker or the Mac restarted.
1. Find the broken link in the chain HAProxy → routers → primary:
docker compose ps -a mysql1 mysql2 mysql3 cluster-init router1 router2 router-lb
2. See the real error by running the same login by hand:
mroot -e "SELECT @@hostname" # root through mysql-router:6446, like monitoring-init
| Error | Cause | Fix |
|---|---|---|
Unknown MySQL server host 'mysql-router' | HAProxy isn't running | docker logs --tail 100 mysql-router. Usually haproxy.cfg lacks its final newline or is unreadable (Lesson 5). Then docker compose up -d router-lb. |
Lost connection ... reading initial communication packet | HAProxy is up, but no router is healthy or there's no primary | http://localhost:8404/stats, then step 3 |
Access denied for user 'root' | MYSQL_ROOT_PASSWORD changed after the volumes were created | Use the original password, or down -v to rebuild |
3. Does the cluster have a primary?
members mysql1 # or mysql2 / mysql3 if mysql1 is down
All OFFLINE (or a single row) means the group never re-formed after a full restart. cluster-init only runs on docker compose up, not when Docker restarts containers itself:
docker compose up -d cluster-init
docker logs --tail 100 -f cluster-init       # → "The Cluster was successfully rebooted."
docker restart mysql-router1 mysql-router2
4. monitoring-init continues on its next retry. If it already gave up: docker compose --profile monitoring up -d.
The dashboard
| Section | Panels |
|---|---|
| Cluster overview | Nodes reachable · Members ONLINE · Current primary · Statements/sec |
| MySQL Routers (via HAProxy) | Healthy routers R/W and R/O · Client sessions via load balancer · Health-check failures (15m) · Router up/down · Open sessions per router · New connections/sec per router · Connection errors & check failures (Lesson 5) |
| MySQL cluster | Node up/down · Statements by node · CRUD by type · Client writes by node · InnoDB row operations · GR backlog · Proposed vs applied transactions · Conflicts & rollbacks · Connections · Network · Group members table |
Hover the ⓘ next to a panel title for an explanation.
| Panel | Metric |
|---|---|
| Nodes reachable | mysql_up |
| Current primary, Members ONLINE, Group members | mysql_perf_schema_replication_group_member_info |
| GR backlog | mysql_perf_schema_transactions_in_queue, mysql_perf_schema_transactions_remote_in_applier_queue |
| Proposed vs applied | mysql_perf_schema_transactions_local_proposed_total, ..._remote_applied_total |
| Conflicts & rollbacks | mysql_perf_schema_conflicts_detected_total, ..._transactions_local_rollback_total |
| Statements, CRUD, writes per node | mysql_global_status_commands_total |
| InnoDB rows | mysql_global_status_innodb_row_ops_total |
| Router panels | haproxy_*, see Lesson 5 |
To change the dashboard: edit it in Grafana, then Export → Export as JSON and overwrite the matching file in monitoring/grafana/dashboards/. UI-only changes are lost on down -v.
Useful PromQL
mysql_up                                                     # 1 = node reachable
max by (member_host) (mysql_perf_schema_replication_group_member_info{member_role="PRIMARY"})
sum by (node) (rate(mysql_global_status_commands_total{command=~"insert|update|delete"}[1m]))
max by (node) (mysql_perf_schema_transactions_remote_in_applier_queue)
..._member_inforeturns 9 series, not 3: each exporter reports every member.max by (member_host)removes the duplicates.- Prometheus 3 may note "metric might not be a counter" for
mysql_global_status_*: MySQL's counters don't end in_total. Harmless.
Watch a failover live
- Open the dashboard (refreshes every 5s).
- Start the transaction loop:
txloop. - In another terminal, kill the primary (Lesson 3).
| Time | What you see |
|---|---|
| immediately | Nodes reachable → 2 |
| ~10s | Members ONLINE → 2, Current primary changes |
| ~15–20s | Client writes by node continues on the new primary; the loop prints OK with the new node= |
after docker start | Members back to 3; GR backlog briefly rises while the node catches up |
Dashboards
Six dashboards, one question each. All are in the folder MySQL HA and linked to each other (menu MySQL HA dashboards, top right).
| # | Dashboard | File | Answers | Lesson |
|---|---|---|---|---|
| 1 | Overview (home) | 1-overview.json | Is everything OK right now? One row per layer: cluster, routing, applications | 4, 5, 8 |
| 2 | MySQL Cluster | 2-mysql-cluster.json | Members and roles, workload per node, replication backlog, conflicts | 4 |
| 3 | Routers & HAProxy | 3-routers-haproxy.json | Router health checks, sessions and errors per router | 5 |
| 4 | Applications | 4-applications.json | Success %, failed vs retried operations, errors absorbed by retry, latency, stale reads | 8 |
| 5 | Failover & Outages | 5-failover-outages.json | Incident view: node → primary → router → app timelines, outage start / end / duration | 7, 8 |
| 6 | Connection Pools | 6-connection-pools.json | Writer / reader pools: active, idle, pending, timeouts | 8 |
Each dashboard starts with a short text explaining how to read it, and every panel has a description (hover the i icon). Two annotations appear on the graphs: purple = a new primary was elected, red = an app's writer path went down or up.
The MySQL HA Lab series
- Series introduction
- Lesson 1: Environment and SQL helpers
- Lesson 2: A self-bootstrapping InnoDB Cluster
- Lesson 3: Failover, quorum and recovery
- Lesson 4: Monitoring with Prometheus and Grafana (you are here)
- Lesson 5: Highly available routing with HAProxy
- Lesson 6: Stale reads and read/write splitting
- Lesson 7: Failover tuning, switchover and partitions
- Lesson 8: A Spring Boot app that survives failover
- Lesson 9: The same app in Go
- Bonus: Operations and troubleshooting
All code is on GitHub: mytechbytes/mysql-ha-lab. Questions or a different result in your lab? Leave a comment below.