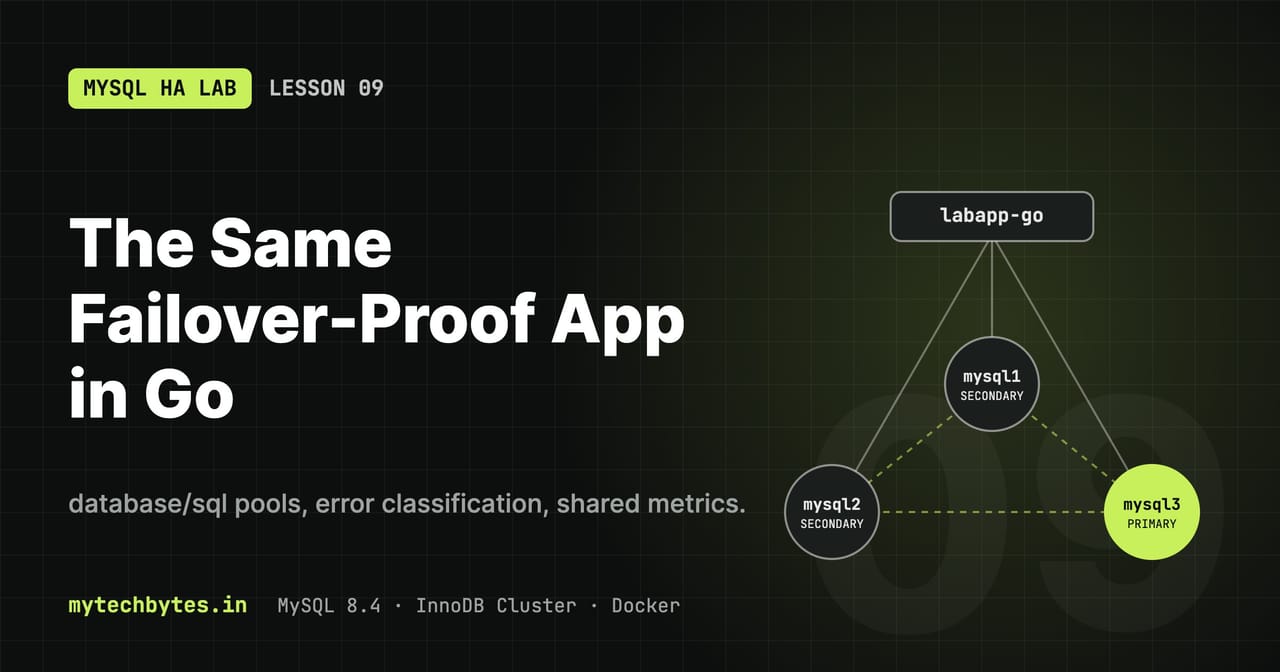
step-10b-go-app on GitHub. Previous: Lesson 8: A Spring Boot app that survives failover.Lesson 8 built a Spring Boot application that turns a database failover into one slow request instead of errors. Is that Spring magic, or a set of patterns any stack can follow? This lesson answers it by building the same application in Go, with only the standard library plus two packages, and running both side by side against the same cluster.
                     ┌───────────────────── labapp-go ─────────────────────┐
 curl / load loop ─► │ net/http  /orders, /whoami, /health/db, /load/*     │
                     │ orders.Service ── retry.Run (whole transaction)     │
                     │   read  ─► go-reader *sql.DB ───────────────────────┼─► HAProxy :6447 ─► Router ─► SECONDARY
                     │   write ─► go-writer *sql.DB ───────────────────────┼─► HAProxy :6446 ─► Router ─► PRIMARY
                     │ Probe (1 s) · /metrics                              │─► Prometheus ─► Grafana
                     └─────────────────────────────────────────────────────┘
The contract both apps share
The Go app copies the Spring Boot app's behaviour, not its code. Anything the dashboards or the tests depend on is identical:
Spring Boot (labapp-springboot) | Go (labapp-go) | |
|---|---|---|
| Schema and user | labapp_springboot | labapp_go (created by cluster-init) |
| Port in Docker / dev | 8080 / 8081 | 8090 / 8091 |
| Endpoints | /orders, /whoami, /health/db, /load/* | same |
| Tables | orders (with request_id UNIQUE), heartbeat | same, created at startup |
| Metrics | app_db_ops_total, app_db_attempt_errors_total, app_db_op_seconds, app_db_stale_reads_total, app_db_probe_up, app_db_outage_* | same names, same labels |
| Pool metrics | hikaricp_* | go_sql_*{db_name="go-writer" | "go-reader"} |
| Label that tells them apart | application="labapp-springboot" | application="labapp-go" |
Because the metric names match, the Application dropdown on the Grafana dashboards from Lesson 8 works for both apps without a single query change.
Layout and dependencies
apps/labapp-go/
├── cmd/labapp/main.go          wiring, HTTP server, graceful shutdown
└── internal/
    ├── config/config.go        environment variables
    ├── db/pools.go             writer/reader pools + InTx
    ├── db/retry.go             retry, error classes, metrics
    ├── db/maxgauge.go          app_db_op_seconds_max (Micrometer-style)
    ├── orders/                 schema, service, handlers, load loop
    ├── health/                 1-second probe, /health/db, /whoami
    └── web/json.go             JSON and 503 helpers
Two dependencies: github.com/go-sql-driver/mysql and github.com/prometheus/client_golang. Routing uses the method-and-path patterns of net/http ("GET /orders/{id}"), so no web framework is needed.
Two pools, configured as a struct
func open(cfg config.Config, port int, name string) (*sql.DB, error) {
	c := mysql.NewConfig() // a Config struct, so the password never needs URL-escaping
	c.User = cfg.DBUser
	c.Passwd = cfg.DBPassword
	c.Net = "tcp"
	c.Addr = net.JoinHostPort(cfg.DBHost, strconv.Itoa(port))
	c.DBName = cfg.DBName
	c.Timeout = 3 * time.Second       // TCP connect + handshake  (Hikari connectTimeout)
	c.ReadTimeout = 15 * time.Second  // one network read           (socketTimeout)
	c.WriteTimeout = 15 * time.Second // one network write
	c.ParseTime = true                // TIMESTAMP -> time.Time
	c.InterpolateParams = true        // send "?" values inline: 1 round trip, no server-side PREPARE
	c.ConnectionAttributes = "program_name:" + config.AppName + ",pool:" + name

	connector, err := mysql.NewConnector(c)
	if err != nil {
		return nil, err
	}
	db := sql.OpenDB(connector)
	db.SetMaxOpenConns(cfg.PoolSize)       // maximum-pool-size
	db.SetMaxIdleConns(2)                  // minimum-idle (roughly)
	db.SetConnMaxLifetime(5 * time.Minute) // max-lifetime
	db.SetConnMaxIdleTime(1 * time.Minute) // idle connections are closed, so few go stale
	return db, nil
}
The writer pool points at port 6446, the reader pool at 6447. sql.OpenDB does not connect, so like Hikari with initialization-fail-timeout: -1, the app starts even while the cluster is down.
Two differences from Hikari matter during a failover:
- No keepalive pings. Instead, the driver checks that a pooled connection is still alive before reusing it, and
database/sqlsilently opens a new one when it isn't. - No separate pool timeout. Waiting for a free connection is bounded by the request's
contextdeadline. Each transaction attempt gets its own 10-second deadline, the equivalent of Spring's transaction timeout.
Classify errors the Go way
flowchart TD
    e(["error from one attempt"]) --> me{"*mysql.MySQLError?"}
    me -- yes --> pc{"Permanent code?"}
    pc -- yes --> stop(["fail fast, tag = code"])
    pc -- no --> rc{"Retryable code<br/>or SQLSTATE 08xxx?"}
    rc -- yes --> retry(["retry, tag = code"])
    rc -- no --> stop
    me -- no --> ctx{"context.Canceled?"}
    ctx -- yes --> stop2(["stop: shutdown"])
    ctx -- no --> dl{"DeadlineExceeded<br/>or ErrTxDone?"}
    dl -- yes --> t(["retry, tag = timeout"])
    dl -- no --> lost{"ErrBadConn, ErrInvalidConn,<br/>EOF, ECONNRESET?"}
    lost -- yes --> r2013(["retry, tag = 2013"])
    lost -- no --> op{"*net.OpError?"}
    op -- "Op = dial" --> r2003(["retry, tag = 2003"])
    op -- "other Op" --> r2013
op -- no --> other(["fail, tag = other"])The Java driver reports client-side failures as numbered SQLExceptions (2003, 2013, SQLState 08S01). The Go driver reports them as network errors (*net.OpError, mysql.ErrInvalidConn, driver.ErrBadConn). Classify maps both worlds onto the same low-cardinality labels, so the "errors by code" panel reads the same for both apps:
func Classify(err error) (tag string, retryable bool) {
	var me *mysql.MySQLError
	if errors.As(err, &me) {
		tag = strconv.Itoa(int(me.Number))
		if permanentCodes[me.Number] {          // 1044, 1045, 1049, 1064, 1142, 1143, 1146
			return tag, false
		}
		return tag, retryableCodes[me.Number] || strings.HasPrefix(sqlState(me), "08")
	}

	switch {
	case errors.Is(err, context.Canceled):
		return "canceled", false
	case errors.Is(err, context.DeadlineExceeded), errors.Is(err, sql.ErrTxDone):
		return "timeout", true
	case errors.Is(err, driver.ErrBadConn), errors.Is(err, mysql.ErrInvalidConn),
		errors.Is(err, sql.ErrConnDone), errors.Is(err, io.EOF), errors.Is(err, io.ErrUnexpectedEOF),
		errors.Is(err, syscall.ECONNRESET), errors.Is(err, syscall.EPIPE):
		return "2013", true // connection lost during a query
	}

	var oe *net.OpError
	if errors.As(err, &oe) {
		if oe.Op == "dial" {
			return "2003", true // could not connect
		}
		return "2013", true
	}
	return "other", false
}
A nice side effect: a wrong password (1045) arrives as a plain *mysql.MySQLError. In Java it was hidden inside a pool timeout and had to be dug out of the cause chain.
Retry the whole transaction
sequenceDiagram
    participant H as HTTP handler
    participant R as retry.Run
    participant T as db.InTx
    participant D as go-writer *sql.DB
    participant M as MySQL via router
    H->>R: Run(ctx, Write, create, fn)
    loop attempt 1 to 8
        R->>R: actx = WithTimeout(ctx, 10 s)
        R->>T: fn(actx)
        T->>D: BeginTx(actx)
        D->>M: START TRANSACTION, INSERT, SELECT, COMMIT
        alt success
            M-->>R: nil
            R-->>H: attempts, nil
        else retryable error
            M--xR: 2013 / 2003 / timeout
            R->>R: count the error, sleep 200 ms to 2 s
        else permanent error
            M--xR: 1045 / 1146
            R-->>H: error, HTTP 503
        end
endfunc (r *Retry) Run(ctx context.Context, kind Kind, op string, fn func(ctx context.Context) error) (int, error) {
start := time.Now()
for attempt := 1; ; attempt++ {
actx, cancel := context.WithTimeout(ctx, r.attemptTimeout)
err := fn(actx) // ONE complete transaction
cancel()
if err == nil {
outcome := "ok"
if attempt > 1 {
outcome = "retried"
}
r.finish(kind, outcome, start)
return attempt, nil
}
tag, retryable := Classify(err)
r.attemptErrors.WithLabelValues(string(kind), tag).Inc()
if !retryable || attempt >= r.maxAttempts || ctx.Err() != nil {
r.finish(kind, "failed", start)
return attempt, err
}
sleep := min(time.Duration(200<<(attempt-1))*time.Millisecond, 2*time.Second)
select {
case <-time.After(sleep):
case <-ctx.Done(): // shutdown
r.finish(kind, "failed", start)
return attempt, err
}
}
}
The same back-off as Spring (200 ms, 400, 800, 1.6 s, then 2 s, at most 8 attempts), and the same metrics. Every counter series is created at 0 when the app starts, because Prometheus' increase() cannot see a series whose first sample is already 1, and the first retry would be invisible on the dashboard.
The idempotent create
attempts, err := s.retry.Run(ctx, db.Write, "create", func(ctx context.Context) error {
	res.Deduplicated = false
	return db.InTx(ctx, s.pools.Writer, false, func(tx *sql.Tx) error {
		_, err := tx.ExecContext(ctx,
			"INSERT INTO orders (request_id, item, qty, written_on) VALUES (?, ?, ?, @@hostname)",
			requestID, item, qty)
		switch {
		case db.IsDuplicateKey(err):
			res.Deduplicated = true // a duplicate key rolls back the statement, not the transaction
		case err != nil:
			return err
		}
		res.Order, err = scanOrder(tx.QueryRowContext(ctx, columns+"WHERE request_id = ?", requestID))
		return err
	})
})
Reads use BeginTx(ctx, &sql.TxOptions{ReadOnly: true}) on the reader pool, which sends START TRANSACTION READ ONLY. A "not found" is returned as nil, not an error, so it never counts as a failed operation.
The metrics, with one gap to fill
All metrics are registered through a wrapped registerer that adds application="labapp-go" to every series, the Go equivalent of Spring's management.metrics.tags.application:
registry := prometheus.NewRegistry()
reg := prometheus.WrapRegistererWith(prometheus.Labels{"application": config.AppName}, registry)
reg.MustRegister(
	collectors.NewGoCollector(),
	collectors.NewProcessCollector(collectors.ProcessCollectorOpts{}),
	collectors.NewDBStatsCollector(pools.Writer, "go-writer"), // go_sql_*{db_name="go-writer"}
	collectors.NewDBStatsCollector(pools.Reader, "go-reader"),
)
mux.Handle("GET /metrics", promhttp.HandlerFor(registry, promhttp.HandlerOpts{}))
The gap: the latency panel also shows app_db_op_seconds_max, which Micrometer adds to every timer automatically and the Prometheus Go client does not. db/maxgauge.go implements it as a small custom collector that reports the largest value of the last one to two minutes and then decays back to zero, like Micrometer's.
Run it
Everything the app needs already exists from Lesson 8: the labapp_go user and schema (from cluster-init), the Compose service and the Prometheus job.
# in Docker -> http://localhost:8090
docker compose --profile app-go up -d --build labapp-go
docker compose logs --tail 100 -f labapp-go

# or on the host -> http://localhost:8091
cd apps/labapp-go && set -a && . ../../.env && set +a
DB_HOST=localhost HTTP_PORT=8091 go run ./cmd/labapp
Startup prints http listening, table ready table=orders, table ready table=heartbeat, probe started and labapp-go ready. The probe and the load loop start only after the tables exist, which avoids the fake outage at startup that Lesson 8 ran into.
curl -s localhost:8090/whoami | jq                 # writer = primary, reader = a secondary
curl -s -X POST 'localhost:8090/orders?item=pen&qty=2' | jq
K=$(uuidgen | tr A-Z a-z)                          # same key twice: 201, then 200 + deduplicated
curl -s -o /dev/null -w '%{http_code}\n' -X POST -H "Idempotency-Key: $K" localhost:8090/orders
curl -s -X POST -H "Idempotency-Key: $K" localhost:8090/orders | jq .deduplicated
The error classification has unit tests that need no database:
cd apps/labapp-go && go vet ./... && go test ./...
Test: both apps under load, then a failover
for p in 8080 8090; do curl -s -X POST localhost:$p/load/reset >/dev/null; curl -s -X POST localhost:$p/load/start | jq -c; done
docker kill $(q 6446)                      # crash the primary
sleep 30; docker start mysql1 mysql2 mysql3
for p in 8080 8090; do curl -s localhost:$p/load/status | jq -c; done
Then set Application = All on the Grafana dashboards.
Results in this lab, one switchover followed by one primary crash, with the Go app running twice (once in Docker and once on the host):
| What | Spring Boot | Go |
|---|---|---|
| Write / read success | 100 % / 100 % (Lesson 8 runs) | 100 % / 100 % |
| Failed operations (user got an error) | 0 (Lesson 8 runs) | 0 |
| Retried writes | 1 over three crashes (Lesson 8) | 3 (two Go instances, two events) |
| Writer outages recorded by the probe | 1 | 2 (one per Go instance) |
| Last writer outage | 7.0 s | 9.0 s (one of the two instances) |
| Reader path | not affected | not affected |
The Go app hid both events completely: no request failed. The higher Go numbers come from the setup, not the code. Two Go instances report under the same application label, so their retries add up, and the host-run instance reaches the cluster through Docker's port forwarding, HAProxy and the router, so it most likely reconnects a little later. For a like-for-like comparison, run only the Docker copy of each app and test one event at a time.
What you learned
- The HA behaviour is a handful of portable patterns: two pools with short timeouts, retrying the whole transaction on a known list of errors, failing fast on configuration errors, idempotent writes, and a probe that records outages.
database/sqlplus a context deadline per attempt gives you what Hikari's connection and transaction timeouts do in Spring.- Each driver reports a lost connection differently; map them to shared labels so one dashboard serves every app.
- Keep metric names identical across stacks and tell apps apart with an
applicationlabel, and the same dashboards work for all of them.
The MySQL HA Lab series
- Series introduction
- Lesson 1: Environment and SQL helpers
- Lesson 2: A self-bootstrapping InnoDB Cluster
- Lesson 3: Failover, quorum and recovery
- Lesson 4: Monitoring with Prometheus and Grafana
- Lesson 5: Highly available routing with HAProxy
- Lesson 6: Stale reads and read/write splitting
- Lesson 7: Failover tuning, switchover and partitions
- Lesson 8: A Spring Boot app that survives failover
- Lesson 9: The same app in Go (you are here)
- Bonus: Operations and troubleshooting
All code is on GitHub: mytechbytes/mysql-ha-lab. Questions or a different result in your lab? Leave a comment below.