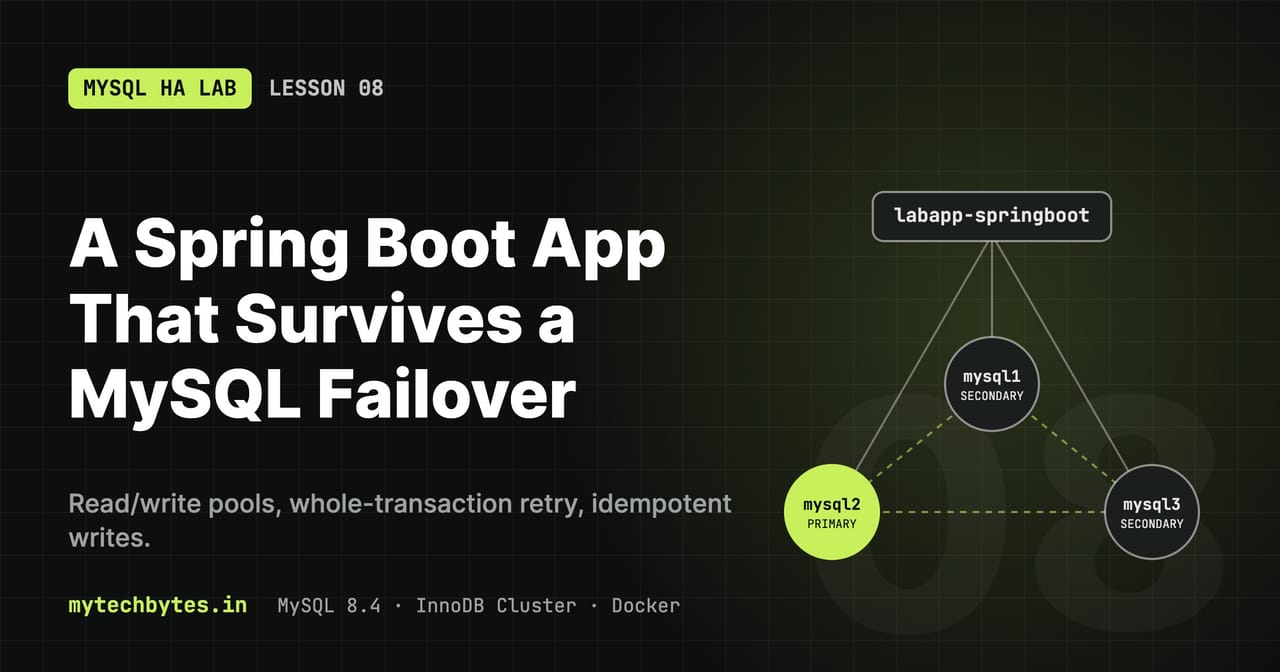
10-spring-app on GitHub. Previous: Lesson 7: Failover tuning, switchover and partitions.Until now every failover was watched from the database side (txloop, mevents) and every crash cost several seconds of FAIL lines. This lesson adds a real application, labapp-springboot, and asks: what does an application experience during a failover, and what must it do so its users don't notice?
                     ┌──────────────── labapp-springboot ────────────────┐
 curl / load loop ─► │ REST /orders, /whoami, /health/db, /load/*        │
                     │ OrderService ── Retry (whole transaction)         │
                     │   readOnly? yes ─► reader pool ───────────────────┼─► HAProxy :6447 ─► Router ─► SECONDARY
                     │             no  ─► writer pool ───────────────────┼─► HAProxy :6446 ─► Router ─► PRIMARY
                     │ DbProbe (1 s) · /actuator/prometheus              │─► Prometheus ─► Grafana
                     └───────────────────────────────────────────────────┘
A second lab app in Go (Lesson 9) follows the same conventions: own schema, own user, same API and metric names, so both can run side by side and share the dashboard.
What is in this lesson
| Path | Purpose |
|---|---|
apps/labapp-springboot/ | Spring Boot 4.1, Java 25, Maven |
.../db/DataSourceConfig.java | Two HikariCP pools (springboot-writer → 6446, springboot-reader → 6447) bound from YAML, read/write routing, writeTx / readTx |
.../db/ReadWriteRoutingDataSource.java | Read-only transaction → reader pool, everything else → writer pool |
.../db/Retry.java | Retries a whole transaction on failover errors; metrics per operation and per failed attempt |
.../web/DbErrorHandler.java | Any controller: a DB error left after retries → 503 with the MySQL error text |
.../orders/* | Orders API, table creation at startup, background load loop |
.../health/* | DbProbe: one write + one read per second, records every outage (start, end, duration); /health/db; /whoami |
.../resources/application.yaml | Pools, timeouts, retry, load, probe, metrics |
.../resources/application-dev.yml | Dev profile: app on the Mac, cluster via localhost:6446/6447, reads ../../.env |
docker-compose.yml | Services labapp-springboot (profiles app, app-springboot) and labapp-go (app, app-go) |
monitoring/prometheus.yml | Jobs labapp-springboot, labapp-go (Docker and dev-mode targets) |
monitoring/grafana/dashboards/4-…, 5-…, 6-….json | Dashboards 4 · Applications, 5 · Failover & Outages, 6 · Connection Pools |
The key code
The full application is in apps/labapp-springboot. Five pieces carry the high-availability behaviour.
Two pools with short timeouts
application.yaml defines a writer pool (router port 6446, always the primary) and a reader pool (port 6447, a secondary). Every timeout is short, so a connection to a dead node fails in seconds instead of hanging:
app:
  datasource:
    writer:
      pool-name: springboot-writer
      jdbc-url: jdbc:mysql://${DB_HOST:mysql-router}:6446/labapp_springboot
      maximum-pool-size: 10
      minimum-idle: 2
      connection-timeout: 3000          # ms to wait for a free connection from the pool
      keepalive-time: 30000             # ping idle connections, so dead ones are found early
      max-lifetime: 300000              # recycle every 5 min
      initialization-fail-timeout: -1   # start the app even if the cluster is not reachable yet
      data-source-properties:           # Connector/J settings
        connectTimeout: 3000            # ms to open a TCP connection
        socketTimeout: 15000            # ms max per network read: never hang on a dead node
        connectionAttributes: "program_name:labapp-springboot,pool:writer"
    reader:
      pool-name: springboot-reader
      jdbc-url: jdbc:mysql://${DB_HOST:mysql-router}:6447/labapp_springboot
      read-only: true
      # same timeouts as the writer
  tx:
    timeout-seconds: 10
  retry:
    max-attempts: 8                     # 200 ms, 400, 800, 1.6 s, then 2 s each
Read-only transactions go to the reader pool
A routing DataSource picks the pool from the transaction's read-only flag. LazyConnectionDataSourceProxy delays fetching the connection until the first statement, when the flag is known:
public class ReadWriteRoutingDataSource extends AbstractRoutingDataSource {
    @Override
    protected Object determineCurrentLookupKey() {
        return TransactionSynchronizationManager.isCurrentTransactionReadOnly() ? READER : WRITER;
    }
}

@Bean @Primary
public DataSource dataSource(DataSource writer, DataSource reader) {
    var routing = new ReadWriteRoutingDataSource();
    routing.setTargetDataSources(Map.of(READER, reader, WRITER, writer));
    routing.setDefaultTargetDataSource(writer);
    routing.afterPropertiesSet();
    return new LazyConnectionDataSourceProxy(routing);
}
Two TransactionTemplates, writeTx and readTx (setReadOnly(true)), both with a 10-second timeout, are all the services use.
Retry the whole transaction, but only for failover errors
flowchart TD
    call(["retry.run(kind, op, tx)"]) --> att["Run ONE complete transaction"]
    att --> res{"Result"}
    res -- success --> first{"First attempt?"}
    first -- yes --> ok(["outcome = ok"])
    first -- no --> rt(["outcome = retried"])
    res -- exception --> perm{"Permanent code?<br/>1044 1045 1049 1064 1142 1143 1146"}
    perm -- yes --> fail(["outcome = failed, HTTP 503"])
    perm -- no --> retr{"Retryable?<br/>2013 2003 1290 3101 08xxx pool timeout"}
    retr -- no --> fail
    retr -- yes --> max{"8 attempts used?"}
    max -- yes --> fail
    max -- no --> wait["Back off<br/>200 ms up to 2 s"]
wait --> attSimplified from db/Retry.java (interrupt handling and logging left out):
/** Failover / switchover errors: retry the whole transaction. */
private static final Set<Integer> RETRYABLE = Set.of(
        1205, 1213, 1290, 1836, 2002, 2003, 2006, 2013, 3100, 3101);

/** Configuration errors: retrying cannot help, fail at once. */
private static final Set<Integer> PERMANENT = Set.of(1044, 1045, 1049, 1064, 1142, 1143, 1146);

public <T> Result<T> run(Kind kind, String op, Supplier<T> body) {
    Timer.Sample sample = Timer.start(registry);
    for (int attempt = 1; ; attempt++) {
        try {
            T value = body.get();                       // ONE complete transaction
            finish(sample, kind, attempt == 1 ? "ok" : "retried");
            return new Result<>(value, attempt);
        } catch (RuntimeException e) {
            registry.counter("app.db.attempt.errors", "kind", kind.tag(), "error", errorTag(e)).increment();
            if (attempt >= maxAttempts || !isRetryable(e)) {
                finish(sample, kind, "failed");
                throw e;
            }
            Thread.sleep(Math.min(200L << (attempt - 1), 2_000L));
        }
    }
}
| Code | Meaning during a failover |
|---|---|
| 2013 / SQLState 08S01 | Connection lost: the node died mid-query |
| 2003 / 08001 | Can't connect: the router closed port 6446 while there is no primary |
| 1290 | --super-read-only: a switchover made the old primary read-only |
| 3100 / 3101 | Group Replication rejected or rolled back the transaction |
| pool timeout | No connection in 3 s, e.g. every connection was to the dead primary |
Configuration errors such as 1045 (access denied) or 1146 (table missing) fail at once: retrying them only turns a clear error into a 30-second hang.
Idempotent writes
A retry can repeat an INSERT whose COMMIT actually succeeded (the connection died before the OK came back). A request_id with a UNIQUE key turns the second insert into a harmless duplicate:
retry.run(Retry.Kind.WRITE, "create", () -> writeTx.execute(s -> {
    try {
        jdbcClient.sql("INSERT INTO orders (request_id, item, qty, written_on) VALUES (:rid, :item, :qty, @@hostname)")
                .param("rid", requestId).param("item", item).param("qty", qty)
                .update();
    } catch (DuplicateKeyException alreadyThere) {
        dedup[0] = true;                       // the earlier attempt did commit
    }
    return jdbcClient.sql(COLUMNS + "WHERE request_id = :rid").param("rid", requestId).query(ROW).single();
}));
Clients can send their own Idempotency-Key header; without one the service generates a UUID per request.
A 1-second probe that records outages
DbProbe writes one heartbeat row through the writer pool and runs SELECT 1 through the reader pool every second, without retry. Each change from up to down and back is logged, exported as metrics (app_db_probe_up, app_db_outage_last_*_seconds) and kept in a history served by /health/db:
INSERT INTO heartbeat (id, beat_at, node) VALUES (1, NOW(3), @@hostname) AS n
ON DUPLICATE KEY UPDATE beat_at = n.beat_at, node = n.node
So the dashboards can show both sides: the probe sees the raw outage, while the retried requests show what users actually experienced.
Setup
1. .env
Each lab app has its own image name, MySQL user and password (.env.example has placeholders):
# Lab apps
LABAPP_SPRINGBOOT_IMAGE=mysql-ha-labapp-springboot:latest
LABAPP_SPRINGBOOT_DB_USER=labapp_springboot
LABAPP_SPRINGBOOT_DB_PASSWORD=change-me

LABAPP_GO_IMAGE=mysql-ha-labapp-go:latest
LABAPP_GO_DB_USER=labapp_go
LABAPP_GO_DB_PASSWORD=change-me
Use plain KEY=value, no quotes: the dev profile reads .env as a properties file, where quotes would become part of the password.
2. Database, user and password
One schema and one user per app. cluster-init creates them automatically on every run (scripts/init-cluster.js, step 5) from the .env values above, on the primary; Group Replication copies them to every node. So after setting .env:
docker compose up -d cluster-init
docker logs --tail 100 cluster-init | grep 'App account'
# App account app: user app ready
# App account labapp_springboot: user labapp_springboot ready
# App account labapp_go: user labapp_go ready
Run it again after changing a password in .env: it re-syncs the password (ALTER USER).
Manual fallback (what step 5 does, if you ever need it by hand):
source scripts/helpers.sh

mroot -e "
  CREATE DATABASE IF NOT EXISTS labapp_springboot;
  CREATE USER IF NOT EXISTS '$LABAPP_SPRINGBOOT_DB_USER'@'%' IDENTIFIED BY '$LABAPP_SPRINGBOOT_DB_PASSWORD';
  ALTER USER '$LABAPP_SPRINGBOOT_DB_USER'@'%' IDENTIFIED BY '$LABAPP_SPRINGBOOT_DB_PASSWORD';
  GRANT SELECT, INSERT, UPDATE, DELETE, CREATE, DROP, INDEX, ALTER
    ON labapp_springboot.* TO '$LABAPP_SPRINGBOOT_DB_USER'@'%';

  CREATE DATABASE IF NOT EXISTS labapp_go;
  CREATE USER IF NOT EXISTS '$LABAPP_GO_DB_USER'@'%' IDENTIFIED BY '$LABAPP_GO_DB_PASSWORD';
  ALTER USER '$LABAPP_GO_DB_USER'@'%' IDENTIFIED BY '$LABAPP_GO_DB_PASSWORD';
  GRANT SELECT, INSERT, UPDATE, DELETE, CREATE, DROP, INDEX, ALTER
    ON labapp_go.* TO '$LABAPP_GO_DB_USER'@'%';"
| Statement | Why |
|---|---|
CREATE DATABASE | Own schema: the apps never see each other's data or the app schema of the shell helpers |
CREATE USER IF NOT EXISTS + ALTER USER | Safe to rerun; ALTER re-syncs the password with .env after you change it |
GRANT ... ON labapp_springboot.* | Least privilege: data and DDL on its own schema only. CREATE is needed because the app creates its tables at startup |
Check:
mroot -e "SELECT user, host FROM mysql.user WHERE user LIKE 'labapp%'"
mroot -e "SHOW GRANTS FOR '$LABAPP_SPRINGBOOT_DB_USER'@'%'"
The tables (orders, heartbeat) are not created by hand: SchemaInit creates them on the primary when the app starts.
3. Run in development mode (on the Mac)
Requires Java 25 and Maven (for example via SDKMAN). The dev profile connects to localhost:6446 / localhost:6447 (published by HAProxy) and imports ../../.env.
cd apps/labapp-springboot
mvn spring-boot:run -Dspring-boot.run.profiles=dev      # http://localhost:8081
IntelliJ: Run configuration for LabappApplication, Active profiles dev, Working directory .../mysql-ha/apps/labapp-springboot (so ../../.env resolves).
4. Run in Docker (on the cluster network)
docker compose --profile app-springboot build labapp-springboot
docker compose --profile app-springboot up -d labapp-springboot
docker logs --tail 100 -f labapp-springboot              # "table orders ready", "Started ..."
The container uses the default profile: mysql-router:6446/6447, user and password from LABAPP_SPRINGBOOT_DB_USER / _PASSWORD via Compose. Port 8080.
5. Verify
curl -s localhost:8081/whoami          # writer = primary (read_only 0), reader = a secondary (read_only 1)
curl -s localhost:8081/health/db       # writer and reader up, no outages
curl -s -X POST 'localhost:8081/orders?item=book&qty=2'
curl -s 'localhost:8081/orders?limit=5'
Which app holds which connections, per node (program_name is set as a connection attribute):
for n in mysql1 mysql2 mysql3; do
  mroot -h $n -P 3306 -N -e "SELECT @@hostname, ATTR_VALUE, COUNT(*) FROM performance_schema.session_connect_attrs
                             WHERE ATTR_NAME = 'program_name' AND ATTR_VALUE LIKE 'labapp%' GROUP BY ATTR_VALUE"
done
Build and tests
mvn package -DskipTests        # just the jar (what the Docker build does)
mvn test                       # needs the cluster running: the test starts the app with the dev profile
LabappApplicationTests is an integration test: it starts the whole application against the cluster with the dev profile. Without the cluster it fails with a pool timeout; use -DskipTests.
Troubleshooting
| Symptom | Cause | Fix |
|---|---|---|
jdbcDialect ... springboot-writer - Connection is not available, request timed out after 3001ms (total=0) during mvn install | Spring Data JDBC (pulled in by spring-boot-starter-data-jdbc-test) opens a connection at startup to detect the dialect, and the test used the default profile, whose host mysql-router does not resolve on the Mac | Remove spring-boot-starter-data-jdbc-test (the app uses JdbcClient, not Spring Data); the test runs with @ActiveProfiles("dev") |
Access denied for user ''@... | .env not found, user empty | Working directory must be apps/labapp-springboot; check spring.config.import in application-dev.yml |
Access denied for user 'labapp_springboot'@... (ERROR 1045, fails at once, not retried) | User missing or password differs from .env | docker compose up -d cluster-init (creates the user and re-syncs the password) |
Unknown database 'labapp_springboot' (ERROR 1049) | Schema not created | docker compose up -d cluster-init |
All writes take ~30 s and fail, probes DOWN, firstError shows pool-timeout ... cause: ... | The pool cannot open any connection; the cause is after cause: | Fix that cause (host, user, schema); configuration errors like 1045/1049 are no longer retried |
Monitoring
The app shows up in four dashboards (Grafana → MySQL HA; the Application dropdown selects labapp-springboot, labapp-go or both):
| Dashboard | What you see for the app |
|---|---|
| 1 · Overview | Write / read path up, success %, failed ops, last outage duration |
| 4 · Applications | Did users notice (success %, failed vs retried) and why (errors by MySQL code, latency, stale reads) |
| 5 · Failover & Outages | Node → primary → router → app timelines on one screen, plus the outage report (start, end, duration) |
| 6 · Connection Pools | Hikari writer / reader pools: active, idle, pending, timeouts |
Metrics used: app_db_ops_total, app_db_attempt_errors_total, app_db_op_seconds, app_db_stale_reads_total, app_db_probe_up, app_db_outage_last_*_seconds, app_db_outage_seconds_count, hikaricp_* (Go: go_sql_*).
Prometheus has two targets per app, one for each way of running it:
| App runs | Target | Shown as |
|---|---|---|
In Docker (--profile app-springboot) | labapp-springboot:8080 | mode="docker" |
| On the Mac, dev profile | host.docker.internal:8081 | mode="dev" |
The one that is not running is simply DOWN in Status → Targets. After changing prometheus.yml or docker-compose.yml:
docker compose --profile monitoring up -d prometheus      # picks up extra_hosts and the new config
docker compose --profile monitoring up -d grafana         # new home dashboard + the 6 dashboard files
Test: primary crash with the app under load
sequenceDiagram
    participant U as Load loop
    participant A as OrderService + Retry
    participant W as Writer pool
    participant H as HAProxy / Router :6446
    participant O as Old primary
    participant N as New primary
    U->>A: create order (request_id = R)
    A->>W: attempt 1
    W->>H: INSERT, COMMIT
    H->>O: forward
    Note over O: killed
    O--xA: 2013 / 08S01 connection lost
    A->>A: back off 200 ms
    A->>W: attempt 2
    W--xA: 2003 / pool timeout (no primary yet)
    A->>A: back off 400 ms, 800 ms, ...
    A->>W: attempt N
    W->>H: INSERT request_id = R
    H->>N: forward to the new primary
    opt the first COMMIT had in fact succeeded
        N--xA: 1062 duplicate key
        A->>N: SELECT by request_id (dedup)
    end
    N-->>A: order row
A-->>U: OK, outcome = retriedcurl -s -X POST localhost:8080/load/start # write + read-back, ~5 per second
docker kill $(q 6446) # crash the current primary
sleep 30; docker start mysql1 mysql2 mysql3 # bring it back (it rejoins as SECONDARY)
curl -s localhost:8080/load/status; echo
curl -s localhost:8080/health/db; echo # outage start / end / first error
Results in this lab (three crashes in 15 minutes: mysql1 → mysql2 → mysql1 → mysql2):
| What | Measured | Where to see it |
|---|---|---|
| Write / read success | 100 % / 100 % | 1 · Overview, 4 · Applications |
| Failed operations (user got a 503) | 0 | 4 · Applications |
| Retried operations (failover hidden by retry) | 1 write | 4 · Applications |
| Slowest write during the failover | ≈ 8 s | 4 · Applications → latency |
| App writer path down (probe) | 7.1 s; reader path not affected | 5 · Failover & Outages, /health/db |
| Writer pool | timeouts up to ~4 / min, then refilled | 6 · Connection Pools |
| Order of events | node down → new primary → routers dip ~2 s → app writer recovers | 5 · Failover & Outages timelines |
Compare Lesson 7: the same crash cost txloop about 6 s of FAIL lines. The application sees the same outage, but as one slow request instead of errors, because:
- pools with short timeouts (
connection-timeout3 s,connectTimeout3 s,socketTimeout15 s) never hang on a dead connection, Retryrepeats the whole transaction on failover errors (2013, 08S01, pool timeout, 1290, …) with back-off up to ~20 s in total, and- the
request_idunique key makes a retried INSERT safe even if the first COMMIT went through.
The probe sees ~7 s rather than Lesson 7's ~6 s because it checks once per second and has to open a new connection through HAProxy and the router after the failover.
Things that were found and fixed while building this lesson:
| Symptom | Cause | Fix |
|---|---|---|
| All writes take ~30 s and fail | Pool could not connect (user missing); a wrapped 1045 was retried as a pool timeout | cluster-init creates the app users; Retry fails fast on 1044/1045/1049/1142/1146 and shows the root cause |
| One fake writer outage at every start | Probe ran before SchemaInit created heartbeat | Probe and load loop start on ApplicationReadyEvent |
| "Retried ops" stayed 0 although a write was retried | A Prometheus counter that first appears with value 1 shows no increase() | Retry registers all app_db_ops_total / error counters at 0 on startup |
| Reads always on the primary | readTx injected with the writeTx qualifier | Correct qualifier; /whoami shows reader = a secondary |
Coming next
- A planned switchover under load (
mprimary): the1290errors should be absorbed by the retry, with no failures - A lost commit (deduplication), stale reads from the application's point of view, and a router failure under load
The MySQL HA Lab series
- Series introduction
- Lesson 1: Environment and SQL helpers
- Lesson 2: A self-bootstrapping InnoDB Cluster
- Lesson 3: Failover, quorum and recovery
- Lesson 4: Monitoring with Prometheus and Grafana
- Lesson 5: Highly available routing with HAProxy
- Lesson 6: Stale reads and read/write splitting
- Lesson 7: Failover tuning, switchover and partitions
- Lesson 8: A Spring Boot app that survives failover (you are here)
- Lesson 9: The same app in Go
- Bonus: Operations and troubleshooting
All code is on GitHub: mytechbytes/mysql-ha-lab. Questions or a different result in your lab? Leave a comment below.